This article is part of the folder : Impact de la crise Covid-19 dans le domaine routier: les webinaires de l'Association mondiale de la route
See the 3 news related to this folder
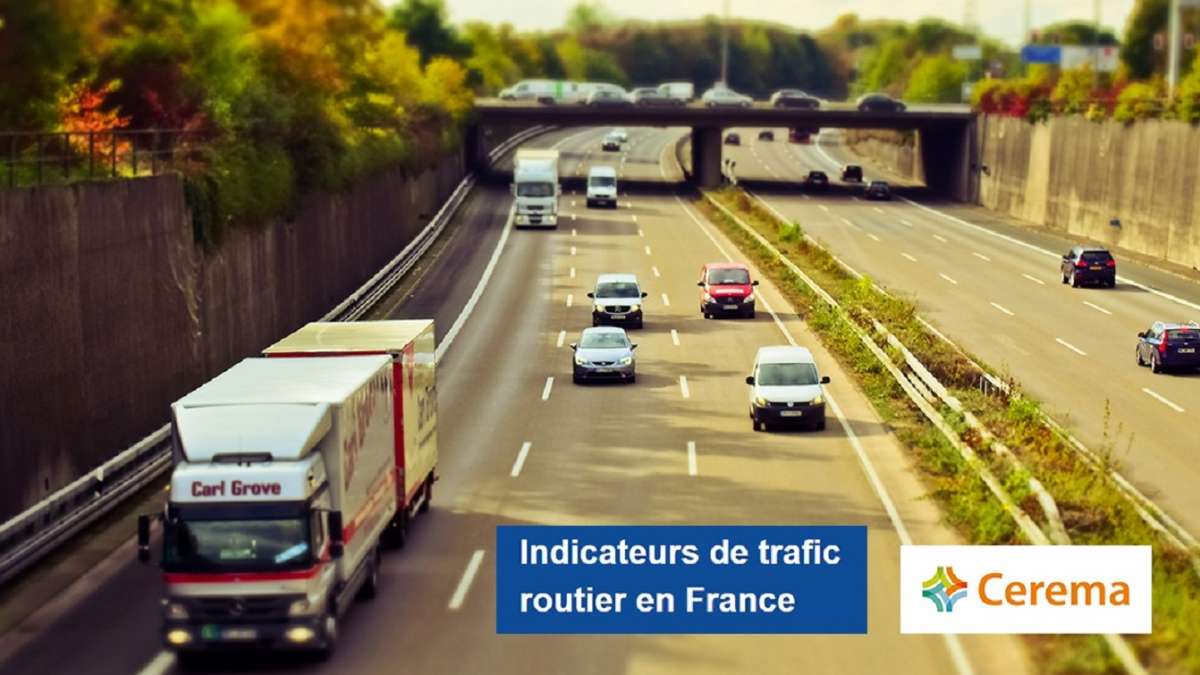
In March, Cerema defined indicators to better understand the impact on road traffic of the lockdown followed by easing of the lockdown, and to provide information about the gradual return of activity.
What impact have health measures had on traffic?
Data from the road traffic monitoring site has just been updated, and shows a significant drop in traffic in all regions since 1st November, but less than was the case for the previous lockdown.
When the lockdown was eased in mid-May, road traffic started to increase and even reached higher levels than in February, before the first lockdown.
At the national level we can observe that at the start of this second lockdown, road traffic is roughly 22% less than the baseline level in January. By comparison, the drop in this level during the first lockdown was 75%.
These indicators are defined by comparing traffic when the lockdown was eased with “pre-crisis” traffic (via the average daily rate from 13 January to 2 February 2020 at more than 1,200 counting stations). They are based on traffic data from the national non-concessionary road network managed by the departments of the ministry for ecological transition, and cover mainland France (excluding Corsica).
The platform also aims to include data from the main conurbations, secondary roads and motorways. Data from suburban roads in certain cities (Bordeaux, Lyon, Nantes, Saint-Étienne, Strasbourg and Toulouse) were added to the platform in early June.
A platform with an open license
This “Road traffic indicators” platform will be updated daily with data from two days beforehand, and is accessible to all via an open license. It can provide decision support for public and private sector players during easing of the lockdown.

Through these indicators it is possible to observe traffic trends at the national, regional and local levels, to draw comparisons between regions, and also to isolate heavy goods vehicle traffic and their average load, in order to evaluate the resumption of logistics activities.
For example, these data can be used to see what has been the immediate impact of lockdown measures on traffic. In the first week of the lockdown road traffic was down by 75%, and then gradually started to rise again.
Cerema is a public body operating under the supervision of two ministries: the ministry for ecological transition in solidarity, and the ministry for regional cohesion.
Discover the platform (beta version):
Road traffic indicators:
In the folder : Impact de la crise Covid-19 dans le domaine routier: les webinaires de l'Association mondiale de la route

